Introduction
Yield curves play a critical role in the world of finance, offering valuable insights into the direction of the economy, interest rate trends, and potential investment risks. For bond investors and financial analysts, understanding the dynamics of yield curves is essential for making informed decisions.
This comprehensive guide explores yield curves, explains their various types, highlights their importance, and analyzes what they reveal about market trends and future economic conditions.
🎯 What Is a Yield Curve?
A yield curve is a graphical representation of the relationship between the interest rates (yields) of bonds with different maturities but similar credit quality. It plots bond yields on the Y-axis and the maturity periods on the X-axis, providing a visual indicator of how market participants perceive future interest rates and economic growth.
✅ Why It Matters:
- 📈 Economic Indicator: Reflects investor sentiment and market expectations.
- 📊 Interest Rate Forecasting: Guides expectations for future interest rate movements.
- 💡 Investment Decisions: Influences asset allocation and risk management strategies.
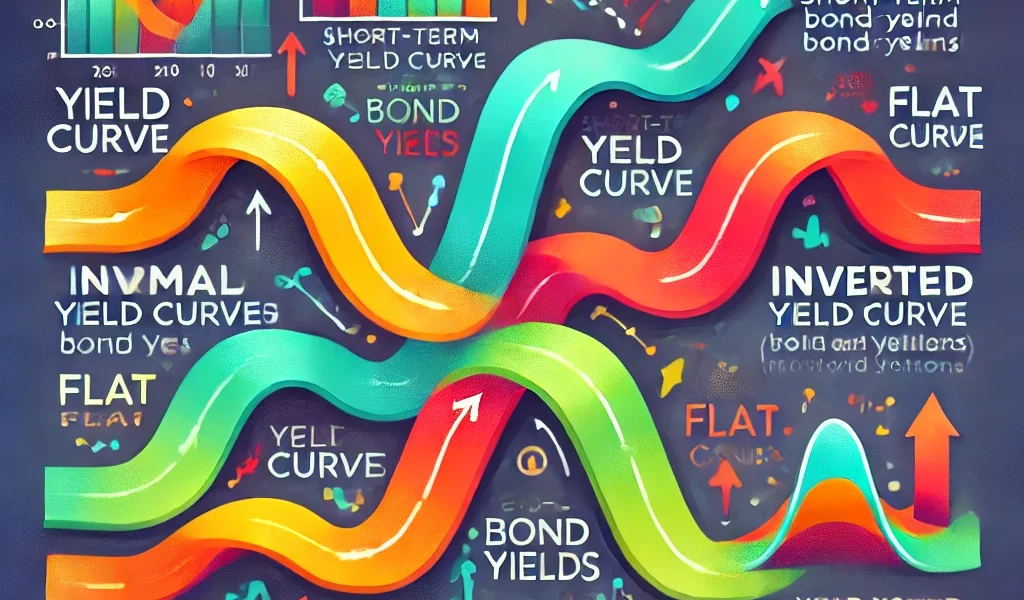
📊 Types of Yield Curves and Their Implications
There are three main types of yield curves, each offering different insights into the market and the broader economy.
✅ 1. Normal Yield Curve (Upward Sloping)
A normal yield curve slopes upward, indicating that longer-term bonds have higher yields than shorter-term bonds.
✅ What It Suggests:
- 📈 Economic Growth: Signals optimism about future economic expansion.
- 📊 Higher Inflation Expectations: Longer maturities demand higher returns to compensate for inflation risk.
✅ Typical Scenario:
- The economy is growing steadily, and investors expect higher interest rates in the future.
✅ Impact on Investors:
- Encourages long-term investments due to favorable returns.
✅ 2. Inverted Yield Curve (Downward Sloping)
An inverted yield curve slopes downward, where short-term bonds have higher yields than long-term bonds.
✅ What It Suggests:
- 📉 Economic Slowdown or Recession: Indicates that investors expect a decline in future interest rates.
- 🛑 Flight to Safety: Investors prefer long-term bonds as a safe haven.
✅ Typical Scenario:
- An economic slowdown or recession is anticipated.
- Central banks may lower interest rates to stimulate the economy.
✅ Impact on Investors:
- Shift towards safer, long-term investments.
- Increased demand for government bonds.
✅ 3. Flat or Humped Yield Curve
A flat yield curve occurs when there is little difference between short-term and long-term bond yields. A humped yield curve has higher yields for medium-term bonds than either short- or long-term bonds.
✅ What It Suggests:
- ⚖️ Uncertainty: Reflects investor uncertainty about future interest rates or economic conditions.
- 📊 Transition Period: Often occurs during shifts in monetary policy.
✅ Typical Scenario:
- The economy is in transition, and the market is awaiting clarity on future interest rate trends.
✅ Impact on Investors:
- Encourages a balanced investment approach.
- Suggests caution with duration and risk exposure.
📈 Factors Influencing Yield Curves
Understanding the factors that shape yield curves can help investors make better decisions.
📊 1. Central Bank Policies and Interest Rates
Central banks, such as the Federal Reserve (Fed) or the Reserve Bank of India (RBI), influence yield curves through changes in monetary policy.
✅ Impact:
- Raising rates typically flattens or inverts the yield curve.
- Lowering rates steepens the yield curve.
📉 2. Inflation Expectations
Investors demand higher yields for longer-term bonds if they expect inflation to rise in the future.
✅ Impact:
- Higher inflation expectations lead to a steeper yield curve.
- Falling inflation expectations can flatten the curve.
🕒 3. Economic Growth and Market Sentiment
Yield curves reflect market confidence or pessimism about future economic performance.
✅ Impact:
- Optimism steepens the yield curve.
- Pessimism flattens or inverts the curve.
💸 4. Supply and Demand for Bonds
Government and corporate bond issuance and investor demand affect the yield curve’s shape.
✅ Impact:
- Increased demand for long-term bonds flattens the yield curve.
- Higher supply of bonds steepens the curve.
🔥 What Yield Curves Reveal About Market Trends
Yield curves are powerful indicators that provide valuable insights into future economic and market trends.
📈 1. Predicting Economic Growth and Recession
A normal yield curve often suggests that the economy is on a growth trajectory, while an inverted yield curve has historically predicted recessions.
✅ Example:
- Inverted yield curves preceded the 2008 Global Financial Crisis and other economic downturns.
📉 2. Gauging Future Interest Rate Movements
The shape of the yield curve offers clues about future interest rate changes.
✅ Normal Yield Curve: Higher future rates.
✅ Inverted Yield Curve: Lower future rates.
📊 3. Assessing Investor Risk Appetite
Yield curves reflect investor sentiment, with normal curves indicating confidence and inverted curves suggesting caution.
✅ Investor Behavior:
- Steeper curves encourage risk-taking.
- Flattened or inverted curves prompt defensive strategies.
⚡ How Bond Investors Can Use Yield Curves for Better Decision-Making
Yield curves provide essential insights that investors can leverage to optimize their bond portfolios and mitigate risk.
✅ 1. Choose Maturities Based on Market Trends
Investors can align bond maturities with yield curve signals.
✅ Normal Curve: Favor long-term bonds.
✅ Inverted Curve: Shift to short-term or floating rate bonds.
✅ 2. Diversify Across the Yield Curve
Creating a laddered bond portfolio helps spread reinvestment risk and ensures stable returns.
✅ How It Works:
- Allocate bonds across short, medium, and long-term maturities.
✅ 3. Use Yield Curve Insights to Adjust Portfolio Duration
Duration measures a bond’s sensitivity to interest rate changes. Investors can use yield curves to manage duration effectively.
✅ Normal Curve: Increase duration for higher returns.
✅ Inverted Curve: Reduce duration to minimize risk.
💡 Case Study: Leveraging Yield Curve Insights
Scenario:
- Investor A is building a $500,000 bond portfolio.
- Based on a flat yield curve, they opt for a diversified portfolio with a mix of short, medium, and long-term bonds to balance risk and return.
✅ Outcome:
- The investor reduces reinvestment risk and maintains consistent returns despite market uncertainty.
⚠️ Potential Pitfalls and How to Avoid Them
⚠️ 1. Misinterpreting Yield Curve Signals
Incorrectly reading yield curve trends may lead to poor investment decisions.
✅ Solution:
- Regularly monitor and analyze yield curve changes.
⚠️ 2. Overconcentration in Long-Term Bonds
Relying heavily on long-term bonds can expose investors to interest rate risk.
✅ Solution:
- Maintain a balanced bond portfolio.
⚠️ 3. Ignoring Yield Curve Inversions
Inverted yield curves signal potential recessions, and ignoring them may lead to unexpected portfolio losses.
✅ Solution:
- Shift towards safer assets during inverted yield curves.
🎉 Conclusion: Unlocking Market Trends Through Yield Curve Analysis
Yield curves are powerful tools that provide valuable insights into economic growth, interest rate trends, and investor sentiment. By understanding the implications of different yield curve shapes, bond investors can make informed decisions, mitigate risks, and enhance portfolio returns.
Monitoring yield curves and adjusting investment strategies accordingly ensures that investors remain well-positioned to capitalize on market trends and navigate uncertain economic environments effectively.