How to Analyze a Mutual Fund: Key Metrics Every Investor Should Know
Introduction
Investing in mutual funds can be a great way to grow wealth, but selecting the right fund requires careful analysis. With thousands of mutual funds available, investors must understand key performance metrics to make informed decisions.
In this guide, we will explore the essential metrics that every investor should analyze before investing in a mutual fund. By the end, you’ll have a clear understanding of how to evaluate funds and select the best one for your financial goals.
Why Analyzing a Mutual Fund is Important
Analyzing a mutual fund ensures that you:
✅ Choose a fund aligned with your investment goals. ✅ Assess potential risks and returns. ✅ Compare funds objectively based on performance. ✅ Avoid funds with high costs or poor management.
Now, let’s dive into the key metrics every investor should know.
1. Expense Ratio
The expense ratio represents the annual fees a fund charges as a percentage of assets under management (AUM). Lower expense ratios lead to higher net returns.
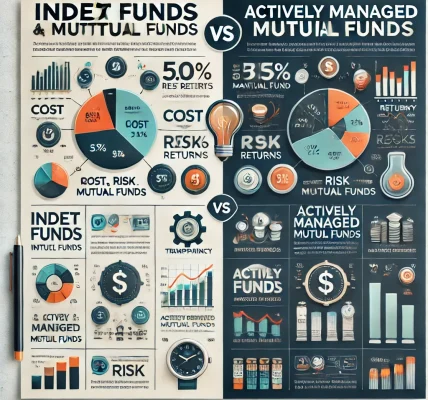
- Actively Managed Funds: Typically have higher expense ratios (0.5%–2.5%).
- Index Funds & ETFs: Have lower expense ratios (0.05%–0.5%).
- Ideal Range: Prefer funds with an expense ratio under 1% for long-term investments.
💡 Example: A fund with a 1.5% expense ratio means you pay $15 annually for every $1,000 invested.
2. Net Asset Value (NAV)
NAV is the per-share market value of the mutual fund and is calculated as:
- NAV is not an indicator of performance. Instead, track its historical trends.
- Compare NAV movements with benchmark indices.
📌 A rising NAV indicates that the fund’s assets are growing.
3. Fund Performance & Returns
Evaluating past performance helps gauge a fund’s consistency and potential future performance.
Key Performance Indicators:
- Annualized Returns: Compare 1-year, 3-year, 5-year, and 10-year returns.
- Benchmark Comparison: Assess if the fund outperforms its benchmark (e.g., S&P 500, NIFTY 50).
- Rolling Returns: Measures returns over different time frames for a more comprehensive analysis.
📊 Example: If a fund has provided 12% annualized returns over 5 years while the benchmark returned 10%, it has outperformed the market.
4. Risk-Adjusted Returns (Sharpe Ratio & Sortino Ratio)
Sharpe Ratio
Measures risk-adjusted returns by factoring in volatility. Higher Sharpe ratios indicate better returns per unit of risk.
Where:
- = Return of the fund
- = Risk-free rate
- = Standard deviation (volatility)
✅ Ideal Sharpe Ratio: Above 1.0 for equity funds.
Sortino Ratio
Similar to the Sharpe ratio but only considers downside risk, making it more relevant for risk-averse investors.
📈 Funds with a high Sortino ratio offer better downside protection.
5. Standard Deviation & Beta (Risk Metrics)
- Standard Deviation: Measures how much a fund’s returns deviate from its average return. Higher values mean more volatility.
- Beta: Indicates how a fund moves relative to the market.
- Beta = 1: Moves in line with the market.
- Beta > 1: More volatile than the market.
- Beta < 1: Less volatile than the market.
💡 For conservative investors, funds with low standard deviation and beta are preferable.
6. Alpha (Fund Manager’s Value Addition)
Alpha measures excess returns generated by the fund compared to its benchmark.
✅ Positive Alpha: The fund has outperformed expectations. ❌ Negative Alpha: The fund underperformed compared to its benchmark.
7. Portfolio Turnover Ratio
This ratio shows how frequently a fund buys/sells holdings.
- High Turnover (Above 50%): May lead to higher costs and tax implications.
- Low Turnover (Below 20%): Indicates a buy-and-hold approach, reducing transaction costs.
🔎 Ideal turnover depends on the fund type. Index funds usually have low turnover, while actively managed funds may have higher turnover.
8. Fund Manager’s Track Record
- Research the experience and past performance of the fund manager.
- Look for consistency in returns across market cycles.
- Managers with a long-term approach tend to generate better results.
📢 A skilled manager with a strong track record is a key asset to any fund.
9. Exit Load & Tax Implications
✅ Exit Load: Some funds charge a fee if you redeem units within a certain period.
- Short-term exit loads: Usually between 0.5%–2%.
- Long-term exit loads: Typically lower or non-existent.
✅ Tax Implications:
- Equity Funds: Gains taxed as per short-term (below 1 year) or long-term (above 1 year) capital gains.
- Debt Funds: Different taxation rules apply.
📌 Choose funds with low exit loads to avoid unnecessary costs.
How to Use These Metrics to Choose the Best Mutual Fund
1️⃣ Define Investment Goals: Growth, stability, or passive income? 2️⃣ Compare Performance Metrics: Look at past returns and risk-adjusted ratios. 3️⃣ Assess Risk Tolerance: Pick funds with suitable volatility levels. 4️⃣ Check Fund Expenses: Lower expense ratios lead to better net returns. 5️⃣ Analyze Manager’s Track Record: A strong history signals good management. 6️⃣ Monitor Regularly: Reassess the fund’s performance periodically.
Conclusion
Analyzing a mutual fund is essential for making smart investment decisions. By understanding expense ratios, risk metrics, historical performance, and fund management, you can select the best fund to meet your financial goals.
📢 Always compare funds based on these key metrics before investing to ensure the best outcomes for your portfolio.
Disclaimer: Mutual fund investments are subject to market risks. Please consult a financial advisor before making any investment decisions.