The stock market operates in cycles, fluctuating between periods of growth and decline. Understanding these cycles can help investors make informed decisions about when to buy and sell stocks. This knowledge can lead to better portfolio management and improved financial outcomes.
What Are Stock Market Cycles?
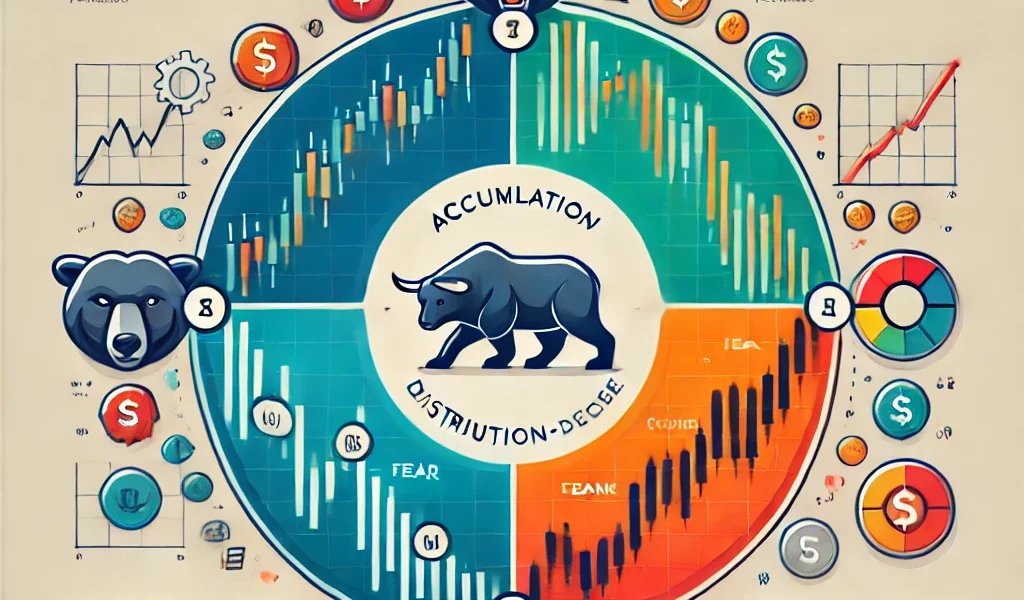
Stock market cycles refer to the recurring trends in stock prices over time. These cycles consist of four key phases:
- Accumulation Phase – This is the period after a market downturn when experienced investors begin buying stocks at low prices.
- Markup Phase – A phase of rising stock prices, driven by increasing investor confidence.
- Distribution Phase – This is when stock prices reach a peak, and informed investors start selling.
- Decline Phase – A downturn in the market as selling pressure increases, leading to falling stock prices.
Understanding the Phases in Detail
1. Accumulation Phase: The Best Time to Buy
This phase occurs after a prolonged market downturn. Stocks are undervalued, and pessimism is at its peak. However, experienced investors and institutional players see this as an opportunity to buy quality stocks at a discount. Key indicators of the accumulation phase include:
- Low trading volume
- Stable or slightly rising prices
- Positive but cautious market sentiment
- Insider buying activity
Investor Strategy:
- Identify undervalued stocks with strong fundamentals.
- Look for companies with solid balance sheets and consistent earnings growth.
- Begin accumulating stocks gradually to benefit from cost averaging.
2. Markup Phase: The Bull Market Begins
Once the accumulation phase gains momentum, stock prices begin rising. Positive economic data and increased investor confidence fuel the market. Retail investors start entering, pushing prices higher.
Key indicators of the markup phase include:
- Higher trading volumes
- Rising stock prices across sectors
- Growing optimism and media coverage
- Increased corporate earnings and economic growth
Investor Strategy:
- Ride the upward trend and hold on to quality stocks.
- Avoid chasing high-flying stocks without strong fundamentals.
- Use trailing stop-loss orders to protect gains.
3. Distribution Phase: Time to Consider Selling
In this phase, stock prices peak, and early investors start booking profits. Retail investors, driven by market euphoria, continue buying. However, smart investors recognize the signs of an overheated market and begin selling gradually.
Key indicators of the distribution phase include:
- High but volatile trading volumes
- Stagnant or slightly declining stock prices
- Increased speculative trading
- Negative divergence in technical indicators (e.g., declining RSI, MACD crossovers)
Investor Strategy:
- Start selling overvalued stocks.
- Reduce exposure to speculative investments.
- Reallocate funds to defensive sectors like utilities and consumer staples.
4. Decline Phase: Market Downturn and Recession
This phase is marked by falling stock prices and increased selling pressure. Economic indicators such as GDP slowdown, rising unemployment, and lower corporate earnings contribute to a bearish market.
Key indicators of the decline phase include:
- High volatility and panic selling
- Negative earnings reports
- Lower trading volumes in upward moves
- Worsening macroeconomic indicators
Investor Strategy:
- Avoid panic selling and stay patient.
- Invest in defensive stocks or bonds.
- Look for value-buying opportunities as the market nears its bottom.
When to Buy Stocks?
- During the accumulation phase, when stocks are undervalued and market sentiment is negative.
- When leading indicators, such as GDP growth and corporate earnings, show improvement.
- During pullbacks in a bull market to acquire stocks at a discount.
When to Sell Stocks?
- During the distribution phase, when stock prices are at their peak and investor euphoria is high.
- When fundamental indicators signal overvaluation, such as high P/E ratios and slowing earnings growth.
- If a company’s business model deteriorates or economic conditions weaken.
Technical Analysis to Identify Market Cycles
Technical indicators help investors identify different phases of the market cycle. Some useful tools include:
- Moving Averages: Help spot trends and reversals.
- Relative Strength Index (RSI): Indicates overbought or oversold conditions.
- MACD (Moving Average Convergence Divergence): Signals momentum shifts.
- Volume Analysis: Helps confirm trends and reversals.
Final Thoughts: The Key to Successful Investing
Understanding stock market cycles is essential for long-term investment success. Investors should focus on:
- Diversification to reduce risk.
- Long-term perspective rather than short-term speculation.
- Regular portfolio reviews to adjust to changing market conditions.
By aligning investment decisions with market cycles, investors can maximize returns and minimize risks, ensuring steady wealth accumulation over time.